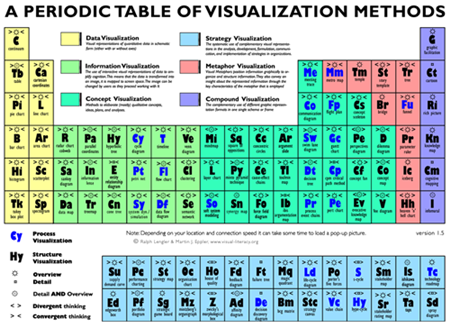
Are you looking for new ideas for communicating knowledge visually? Where do you go to quench your thirst for creative energy and ideas? Sometimes, the answer is just a click away. Yesterday, a collegue exposed me to the mind bending visuals presented on the Periodic Table of Visualization Methods.
Ever thought of using a metro map as a metaphor? Or how about reinventing the org chart as a football stadium?
I just had to share this discovery with y’all.
Ooooo…. (sounding like the green guys from Toy Story) That’s pretty cool, Glenda. I take it you’re chock full of inspiration after these conferences?
Wow! I feel like if I learned this, I would actually know something.
I’m full of new ideas…but I’ll admit I’m exhausted. I’m really looking forward to a less hectic travel schedule!